
Recently, there has been a lot of talk about the U.S. national debt hitting $40 trillion. We are now spending more on interest payments than on defense, and we’re told that even some economists who weren’t previously worried about the debt are starting to panic.[i]
Those are legitimate concerns. But there is a potential problem for investors when the most visible information becomes the primary information shaping their view of the financial environment.
Markets are more complex than a few headlines.
What Else Should Investors Know?
Other information paints a somewhat different picture. The Wall Street Journal reports that for the first time in four years, all leading economic indicators were positive.[ii]
Consider household finances. We frequently hear about record levels of consumer debt, but the size of the debt alone doesn’t tell us much about the financial health of American households.
Look at the other side of the balance sheet.[iii]
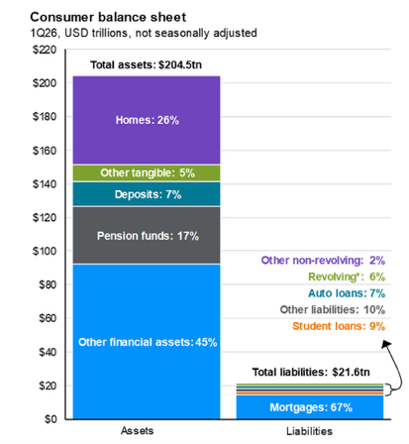
U.S. households have approximately $204.5 trillion in assets compared with $21.6 trillion in liabilities. That’s more than nine times as many assets as liabilities.
This doesn’t mean that every household is financially strong or that there aren’t legitimate risks to the economy. It simply provides additional information.
Goldman Sachs CEO David Solomon recently described the economy as being in “very, very good shape.”[i]
That’s quite a contrast to the $40 trillion debt headlines. And that’s the point.
Perspective Matters
Our minds naturally give greater weight to information that is prominent, dramatic, and concerning. The answer isn’t to ignore concerning information. Nor is it to search for positive information simply to make ourselves feel better.
It’s to seek a more complete picture before making a decision. Good investment decisions often require seeking additional information and perspective beyond the major headlines.
©The Behavioral Finance Network
[i] Source: The Atlantic, Aug 26, 2026
[ii] Source: WSJ, Aug 21, 2026
[iii] Source: FactSet, FRB, J.P. Morgan Asset Management; (Top and bottom right) BEA.
Data include households and nonprofit organizations. *Revolving includes credit cards. Values may not sum to 100% due to rounding. **Periods for which official data are unavailable are J.P. Morgan Asset Management estimates. Household debt service ratio data from 1Q80 to 4Q04 are J.P. Morgan Asset Management estimates. Due to the moratorium on delinquent student loan payments being reported to credit bureaus, missed federal student loan payments were not reported until 4Q24. Guide to the Markets – U.S. Data are as of July 31, 2026.
[iv] Source: CNBC, Aug. 10, 2026